# Terrain and cross-sections
Many civil engineering related works need to review longitudinal and cross-sections using existing infrastructure and terrain.
In Civillo, a cross‐section is a plane that cuts vertically through the map to reveal a two-dimensional grid of the assets that intersect with the vertical plane.
# Open the cross section tool
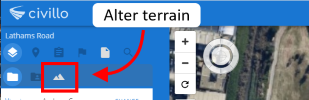
From the map toolbar, click on the ![]() icon to activate the cross-section panel. The panel will open from the bottom of the web page.
icon to activate the cross-section panel. The panel will open from the bottom of the web page.
# Navigation
Scroll the mouse wheel or double-click to zoom in on the cross section. Drag to pan the view.
# Cross-section markers
Initially, two markers are displayed on the map, labelled A and B. The path between these markers defines where the cross section is taken. Markers can be moved or added to create a multi-point cross section path.
Additional markers can be added to the cross-section by left-clicking on the map.
Markers can be moved around the map by dragging.
Markers can be removed by right-clicking on the marker label (or next to the marker when in 3D mode).
#  Vertical exaggeration
By default, the cross section tool will manage its own vertical exaggeration (VE) value, aiming to contain all data within the viewport while ensuring the AB line takes up all of the horizontal space.
Should you wish to enforce a specific VE, you can select one of the pre-configured values from the VE drop-down. The available values are:
- 1:1
- 2:1
- 4:1
- 8:1
When selecting a specific VE the ratio will be locked automatically. This means that even when you zoom or adjust the AB line the ratio between the X and Y axis will remain constant. You can lock/unlock the VE at any time by clicking the ![]() icon.
icon.
#  Measure tool
The measure tool allows you to measure distances or areas on the cross-section graph using arbitrary points.
To use the measure tool, click on the ![]() to select the tool. You can then click on the cross section graph to start adding points. To close a polygon and view the area, double-click on an existing point.
to select the tool. You can then click on the cross section graph to start adding points. To close a polygon and view the area, double-click on an existing point.
# Show axis separation
While the measure tool is selected, you can toggle the axis separation for the last two measure points by clicking on the ![]() icon.
icon.
#  Hitline
The hitline tool allows you to view the details of features that intersect with the hitline.
To use the hitline tool, click on the ![]() icon. Now when you hover over the cross section graph, a vertical line is shown at the hover point. The hitline labels all elements that it intersects with, each label containing the element sub-layer and the elements reduced level height (RL). You can persist hitline labels by clicking on the hitline when the desired label is visible. Persisted labels can be dragged around the graph and removed at any time.
icon. Now when you hover over the cross section graph, a vertical line is shown at the hover point. The hitline labels all elements that it intersects with, each label containing the element sub-layer and the elements reduced level height (RL). You can persist hitline labels by clicking on the hitline when the desired label is visible. Persisted labels can be dragged around the graph and removed at any time.
TIP
When opening the cross section tool the hitline tool is activated by default.
#  Center view
Click the ![]() icon to center the graph viewport around the available data. This option preserves any persisted measure points or hitline labels, and retains the selected vertical exaggeration if locked.
icon to center the graph viewport around the available data. This option preserves any persisted measure points or hitline labels, and retains the selected vertical exaggeration if locked.
#  Reset
Reset
Click the ![]() icon to reset the tool. This removes any existing measure points or hitline labels and unlocks the vertical exaggeration, setting the viewport to contain all available data with the AB markers filling the horizontal space.
icon to reset the tool. This removes any existing measure points or hitline labels and unlocks the vertical exaggeration, setting the viewport to contain all available data with the AB markers filling the horizontal space.
#  Display settings
Click the ![]() icon to bring up the display settings menu. The following options can be toggled to change the data shown on the graph.
icon to bring up the display settings menu. The following options can be toggled to change the data shown on the graph.
# Height labels
Determines how heights are formatted in hitline labels.
- Absolute (default): Height values to the relative height datum
- Relative: Height values are relative to the current terrain model
# Label detail
Determines the level of details displayed in hitline labels
- Simple (default): The height value is displayed in the label
- Detailed: The hit sublayer name is also displayed in the label
# RLs
Determines whether or not RL leader labels are shown.
- Hide (default): RLs are not shown
- Show: RLs are shown
# Leader labels
Determines whether feature sublayer names are displayed via leader labels.
- Hide (default): Sublayer names are not included in leader labels
- Show: Sublayer names are included in leader labels
# 2D data
Determines whether 2D data is included in the graph.
- Show (default): 2D data is shown in the cross section graph
- Hide: 2D data is not shown in the cross section graph
# Terrain
Determines whether the terrain line is included in the graph.
- Show (default): Terrain line is shown in the cross section graph
- Hide: Terrain line is not shown in the cross section graph
#  Export
Click the ![]() icon to open up the export menu. You can export the cross section visualization as either a PDF or an image (PNG).
icon to open up the export menu. You can export the cross section visualization as either a PDF or an image (PNG).
#  Help
Help
Click the ![]() icon to open up the
cross section documentation.
icon to open up the
cross section documentation.
#  Close
Close
Click the ![]() icon close the cross section tool.
icon close the cross section tool.
# Change Terrains
Alter the terrain within the cross-section by changing the Terrain dropdown selection.
# Example workflow
- Open the cross section tool from the map toolbar.
- Adjust the A and B markers to define your cross section path.
- Use the measure tool to check distances or areas along the section.
- Use the hitline tool to inspect intersecting features and view RLs.
- Adjust display settings as needed for your analysis.
- Export your cross section as a PDF or image for reporting or sharing.